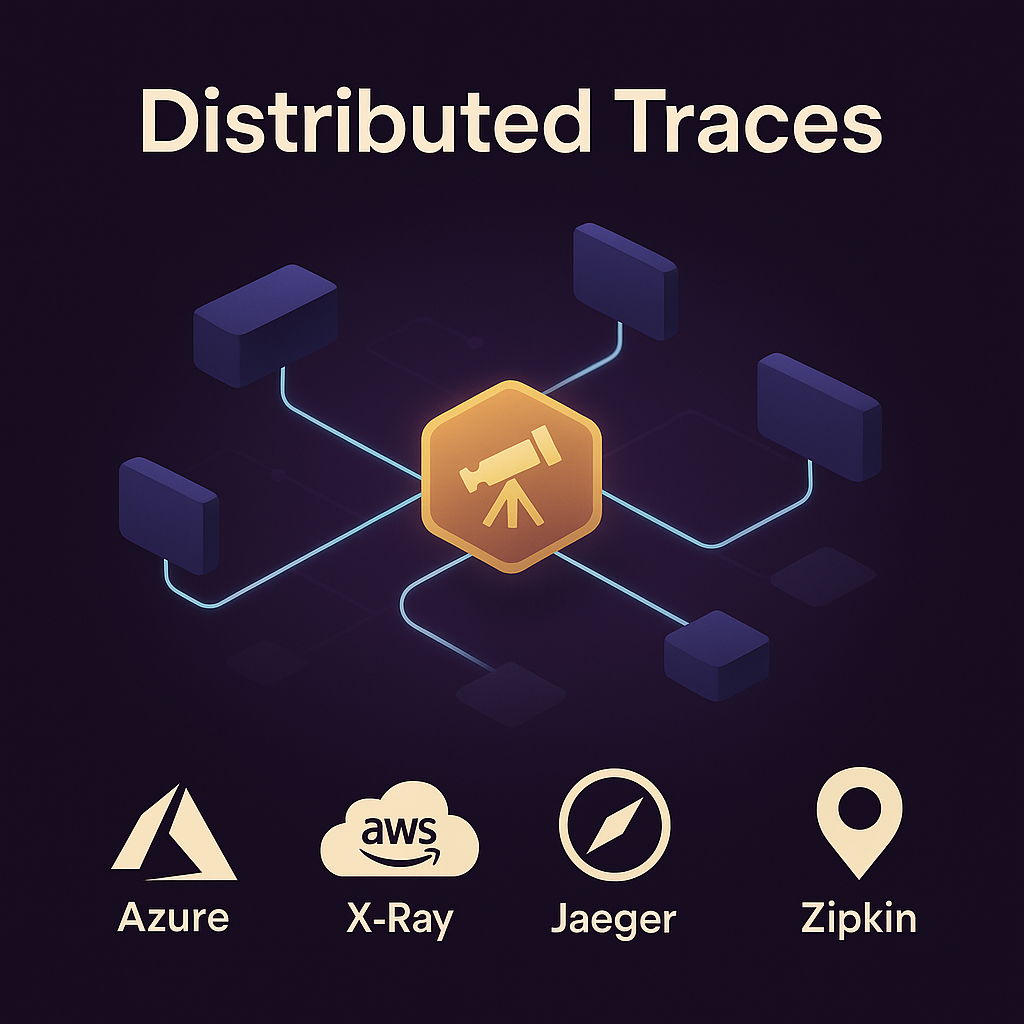
🔁 Distributed Traces for Performance Insights
Trace Every Request. Pinpoint Every Delay.
In complex microservices or cloud-native systems, traditional logs aren’t enough. Distributed tracing offers a holistic view of request lifecycles across services — helping DevOps and SRE teams optimize performance with precision.
Key Benefits:
SLI/SLO Alignment: Correlate user experience with system behavior.
End-to-End Visibility: See how each service handles a request — from API Gateway to backend DB.
Bottleneck Detection: Instantly spot latency within a specific microservice or external call.
Root Cause Analysis: No more guesswork — trace failures across hops with millisecond precision.
📊 Prometheus + Grafana for Observability
The Gold Standard for Cloud Monitoring
Prometheus scrapes metrics, Grafana visualizes them. Together, they form a robust, real-time observability stack.
What You Can Track:
Alerting Rules: Automatically trigger alerts based on PromQL expressions
Service Latency & Error Rates (via RED metrics: Rate, Errors, Duration)
System Metrics: CPU, memory, I/O, and network performance
Custom Business Metrics: Cart abandonment, user sessions, feature usage
You can’t improve what you can’t measure — observability turns raw data into real decisions.
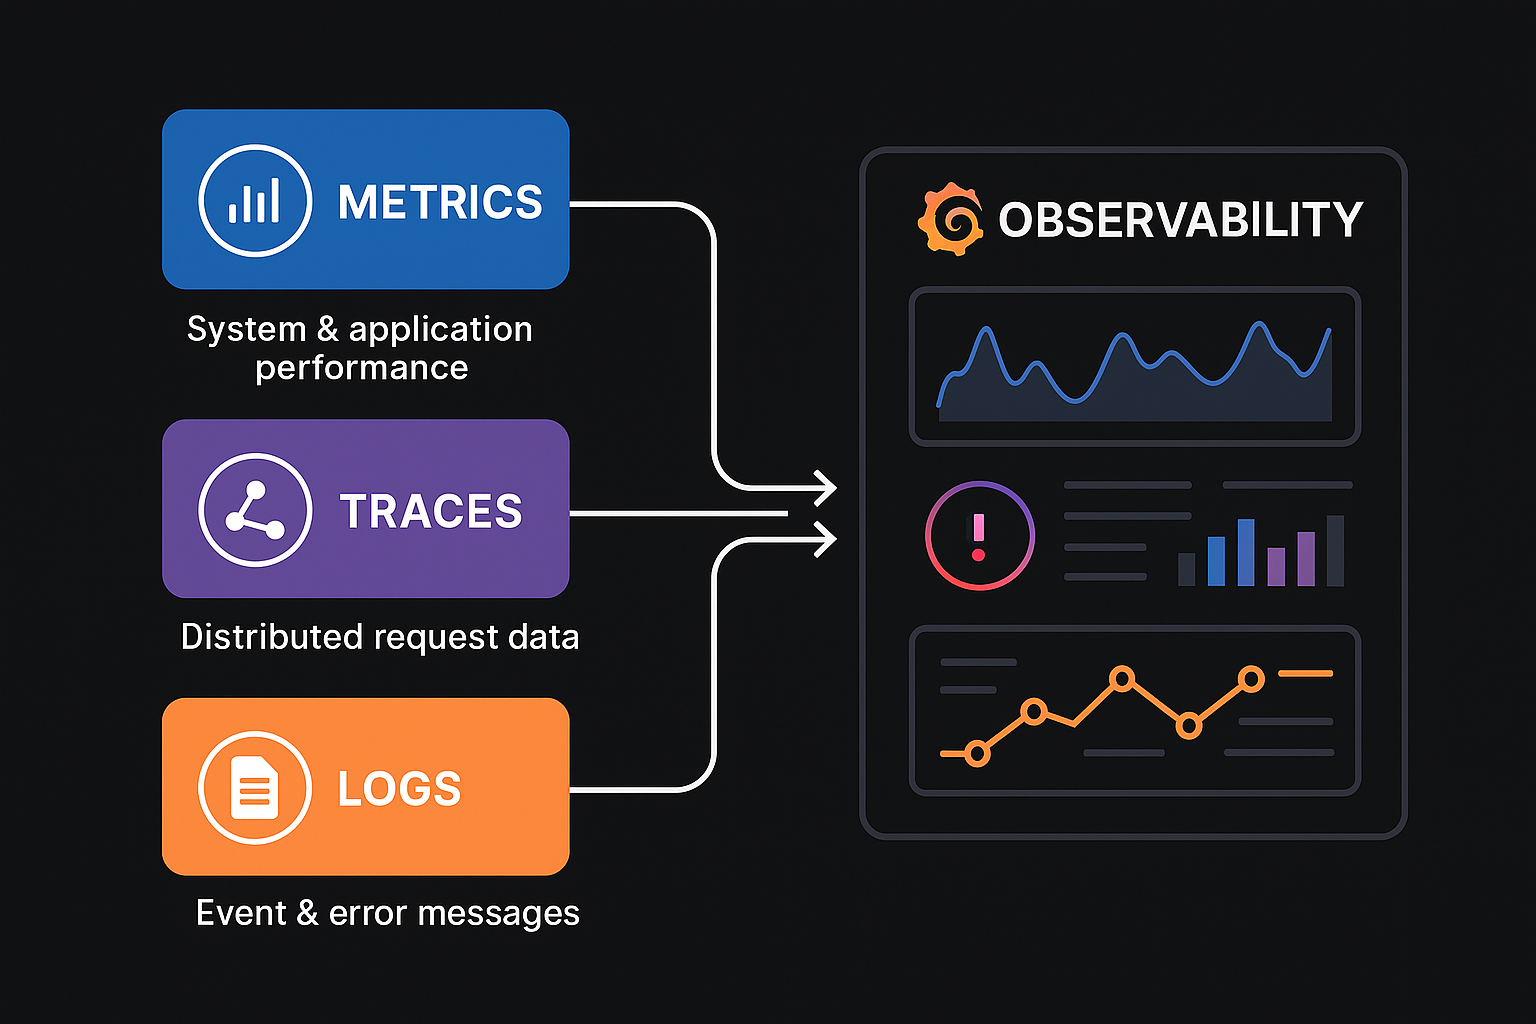
📌 Combined View: Metrics + Traces + Logs = True Observability
Modern APM stacks like:
- Grafana Tempo or Jaeger for Tracing
- Loki for Logs
- Prometheus for Metrics
Together create a 360° Observability Dashboard within Grafana — making incident diagnosis 10x faster.